CAN Log Analyzer
A web-based tool for analyzing CAN log files using NiceGui, Plotly, and cantools.
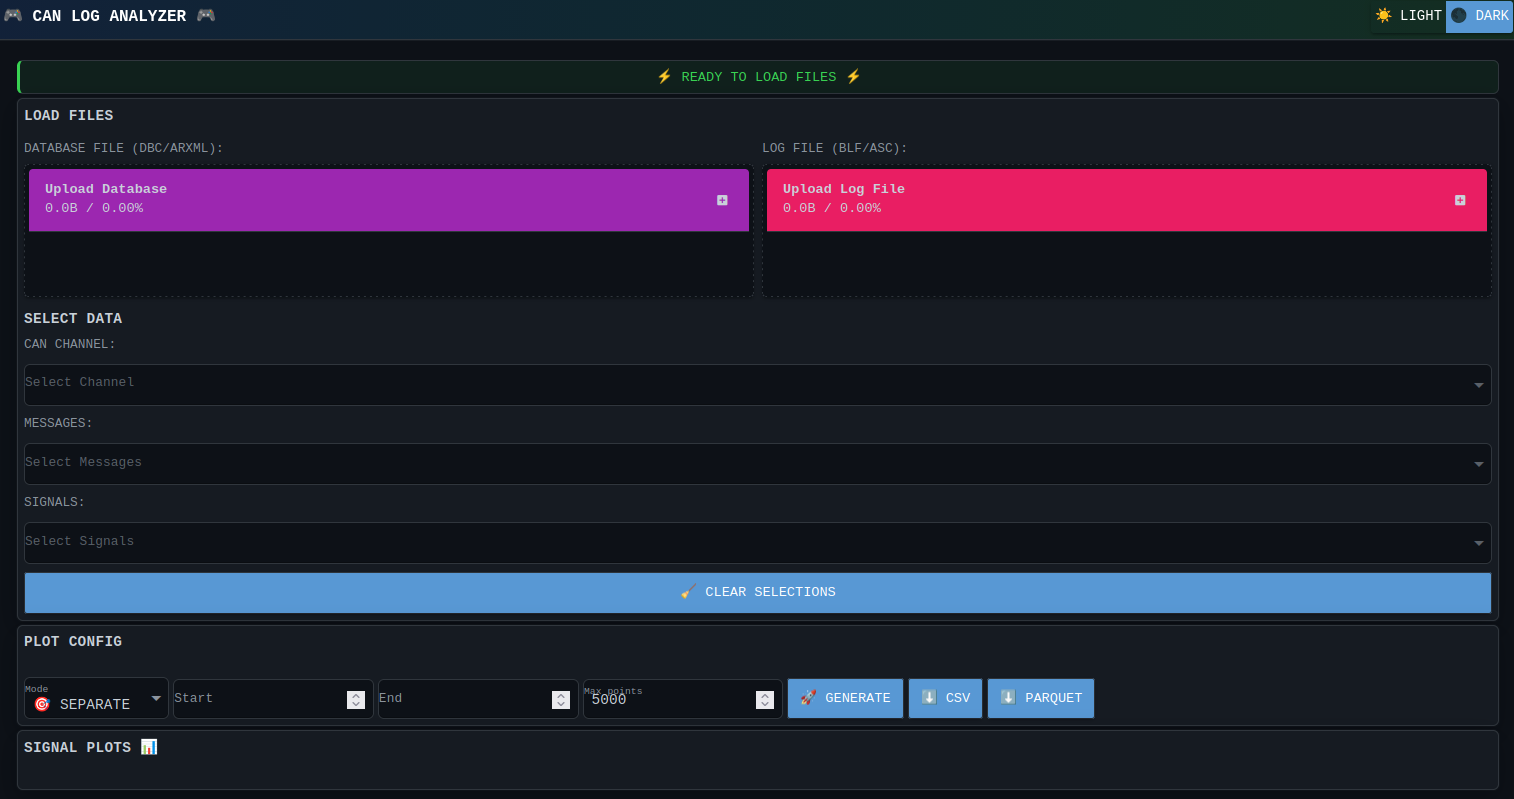
Features
- Upload and parse CAN log files (
.asc,.blf) - Load CAN database files (
.dbc) - Visualize and plot selected CAN signals interactively
- User-friendly web interface with sidebar controls
- Interactive signal selection and customizable plots (scatter, line, heatmap)
- Grid and axis customization for detailed analysis
Notes
- Ensure you are using Python >= 3.10 as specified in the project requirements.
- Only
.dbcfiles are supported for CAN database input.
Usage - Web App
The application can be launched in any of these ways:
python -m can_log_analyzer
can-log-analyzer
uv run can-log-analyzer
- The app will launch in your default web browser at
http://localhost:8080by default. - Use the sidebar to upload your CAN log files (
.asc,.blf) and CAN database files (.dbc). - Select channels, messages, and signals to visualize.
- Choose plot type and customize grid/axis options as needed.
- Interactive plots and analysis will be available after loading your files.
Usage - Development Scripts
The repository includes OS-specific wrappers under scripts/ for common workflows.
Linux:
./scripts/venv_setup.sh
./scripts/build_wheel_package.sh
./scripts/run_pytests_with_report.sh
./scripts/deploy_docs_to_github.sh
Windows:
scripts\venv_setup.bat
scripts\build_wheel_package.bat
scripts\run_pytests_with_report.bat
scripts\deploy_docs_to_github.bat
Both sets of scripts install uv if missing, sync dependencies with uv sync --link-mode=copy, and then execute the requested task.